EEG Studio
Keep waveforms, spectra, coherence networks, scalp maps, complex states, and marked blocks together on one continuous recording page. Load saved trajectories and fits in their own study view.
Recording → measurement BioReg StudioOpen explorer
 Critical Attention Systems / BioReg
Explore how EEG changes across baseline, disturbance, and recovery. Follow the observations, inspect the models, and keep the evidence in view.
EEG research software · Development reviewed 6 October 2026
01 / The working environment
The installed BioReg application connects acquisition, measurement, exploration, and storage. Each workspace keeps the source and its processing history accessible.
Keep waveforms, spectra, coherence networks, scalp maps, complex states, and marked blocks together on one continuous recording page. Load saved trajectories and fits in their own study view.
Recording → measurementCompare theta, alpha, and beta activity with a compatible control recording or an explicitly marked baseline. Inspect activity, change curves, window counts, and descriptive spread; export the selected observations.
Observation → comparisonRecord through supported BrainFlow/OpenBCI devices, select visible channels, and mark study blocks on the recording timeline.
Device → recordingOrganize pseudonymous session summaries, data quality, provenance, and optional self-reports. Raw EEG remains in its source files.
Session → research recordCurrent recording workspace
Section links move through the same page. Double-click a plot to enlarge it; Close or Escape returns it to its place.
Waveforms and spectra lead into coherence matrices, networks, and all-band scalp maps. Recording tools cover delta through gamma.
Sᵥₙ, electrode-basis Sdiag, and their derived gap appear in separate panels on a shared time axis. Complex matrices use the selected band and physical time window.
Select electrodes on the head diagram to show their phase traces. All and None adjust the display without changing the measured channels or reference.
Saved fits contain exported curves. Recording-level plots use actual EEG samples. A new recording replaces the current study only after analysis succeeds.
This web edition opens the saved v13 results and a local observation journal. Recording import, EEG processing, device connections, and Atlas run in the installed application.
Open journal ↗02 / The latest analysis
The September 2026 study fits a five-factor model separately to each participant and each band. The explorer displays the exported observations and model curves directly.
Move between theta, alpha, and beta. Compare a conditional one-step fit with a baseline-calibrated free run. Inspect the residuals and the missing windows alongside the curves.
Open the results explorer ↗Read the technical report ↗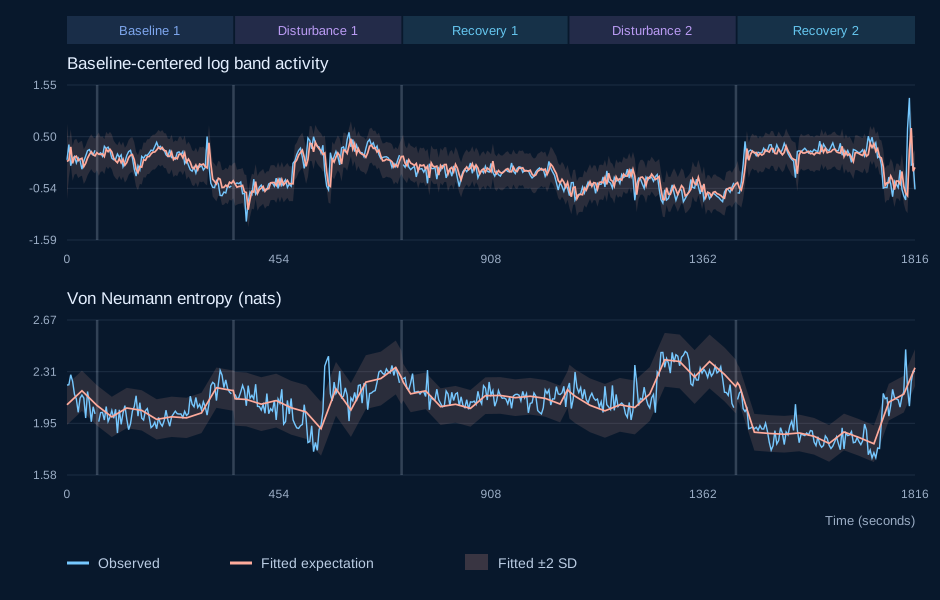
Fits converged in the accepted result set.
Entropy points within two fitted residual standard deviations.
Parameters and phase entropy corrections use the displayed participants’ data. Coverage describes fit, not predictive accuracy.
03 / What comes next
BioReg separates implemented tools, completed analyses, and the questions that still need an independent test.
The current study describes accepted Laplacian EEG measurements over a stitched baseline–disturbance–recovery trajectory. Each participant and band has its own parameters.
The five-factor model and its phase corrections need matching recovery tests and participant-held-out evaluation before predictive claims can be made.
Attention studies
The installed app includes eight preprocessed 16-second excerpts from two participants: breath counting, physical-sensation practice, and instructed active-thinking controls. These controls are not resting baselines. Compatible reference comparisons help explore EEG differences; the short examples demonstrate the workflow without establishing an effect of practice.
04 / Behind the workspace
BioReg handles recordings and the interface. BioReg-EEG performs the scientific measurement. BioReg-Analysis builds and evaluates exploratory models.
Files, devices, labels, workspaces, storage
Quality, spectra, coherence, complex states, entropy
Model trajectories, uncertainty, residuals, reports